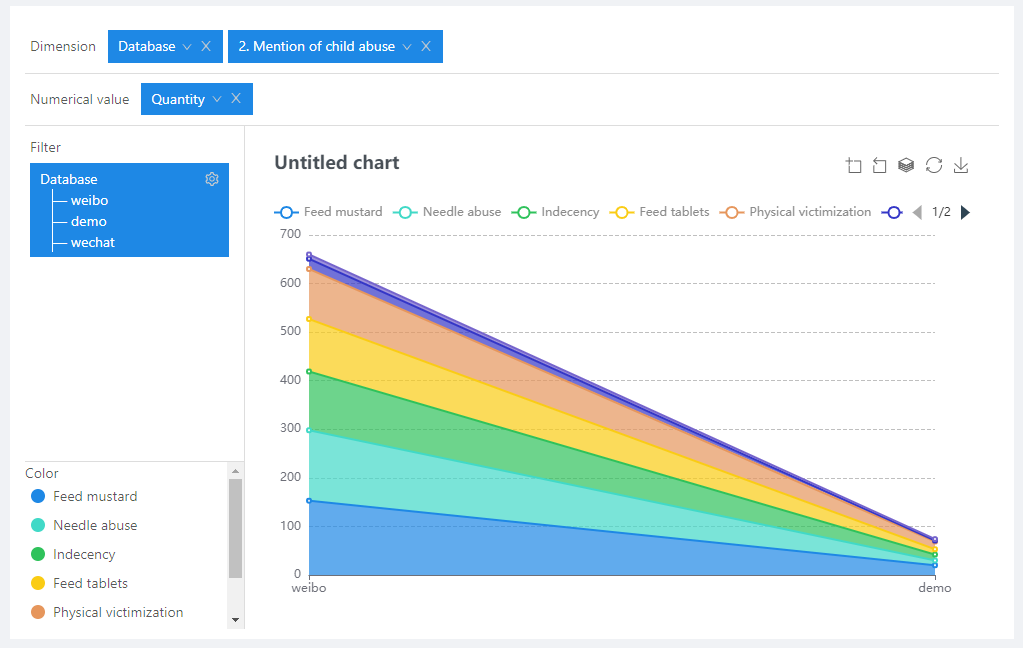
A stacked area graph is a special area graph that can be used to compare multiple variables in an interval. The difference between a stacked area graph and an area graph is that the starting point of each data series of the stacked area graph is drawn based on the previous data series. As such, the fully-stacked height of the topmost line will correspond to the total when summing across all groups. For example, the figure below shows the distribution of different child abuse behaviors in the mentioned incidents.