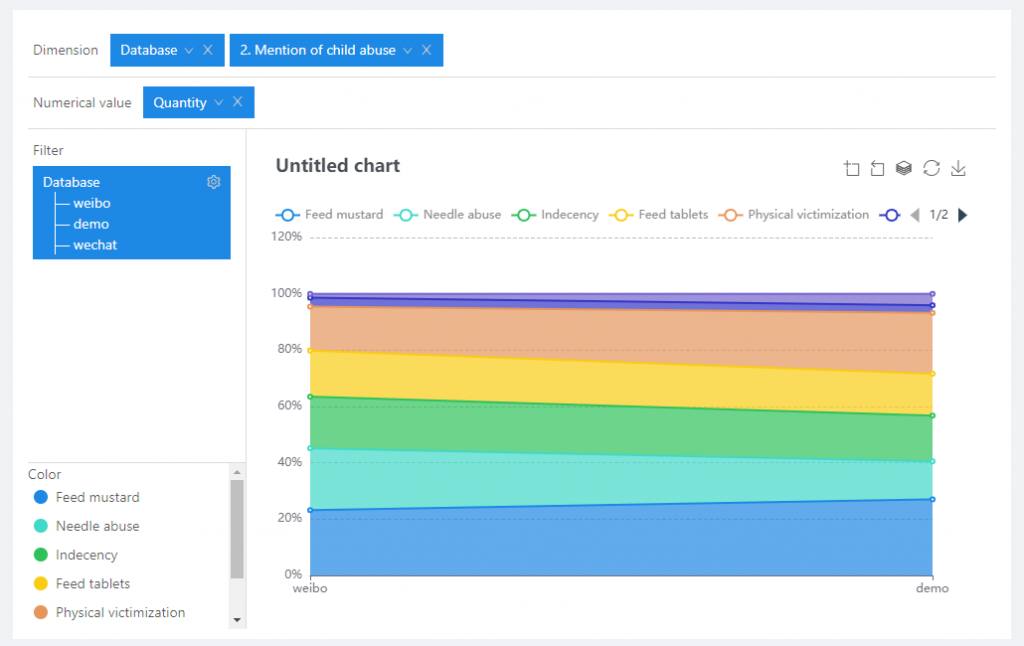
On the basis of the stacked area graph, the total amount of the dependent variable data of each area is added to form the percentage stacked area graph. The graph does not reflect the total change, but it can clearly reflect the variation of each of several variables simultaneously as well as their percentage ratio over time. For example, the figure below shows the percentage of distribution of different child abuse behaviors in the mentioned incidents.