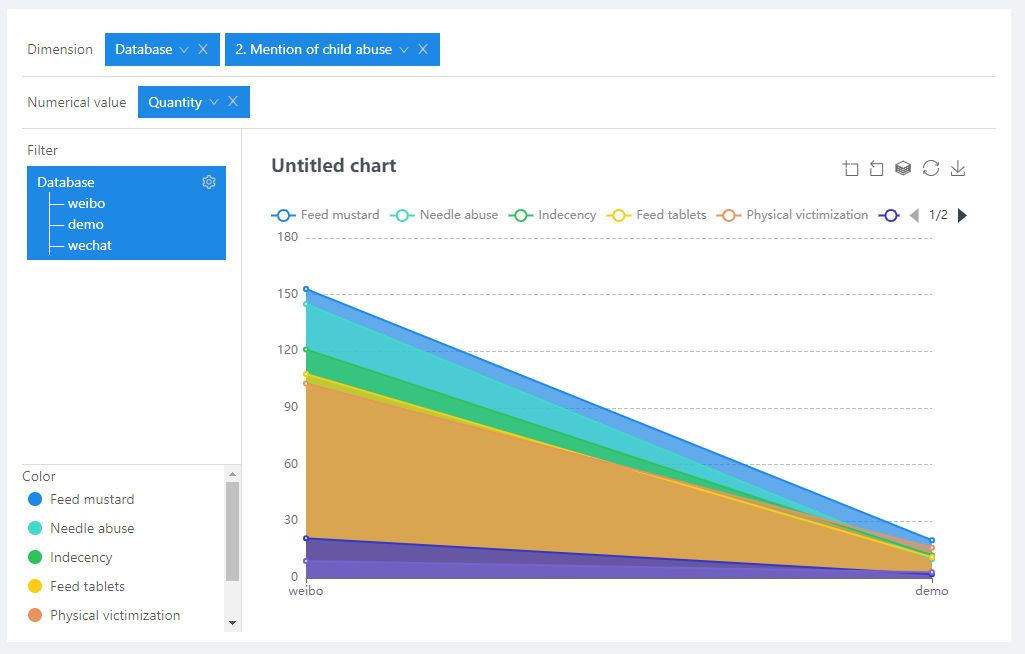
An area graph is a type of line graph, but the area under the line is filled with color or texture. To draw an area graph, first mark each data point on the Cartesian two-axis coordinates, then connect them with a line, and finally fill the space below the line. Like a line graph, an area graph can show the change and development of quantitative values in a certain period of time. It is often used to show trends rather than specific values. For example, the figure below shows the distribution of different child abuse behaviors in the mentioned incidents.