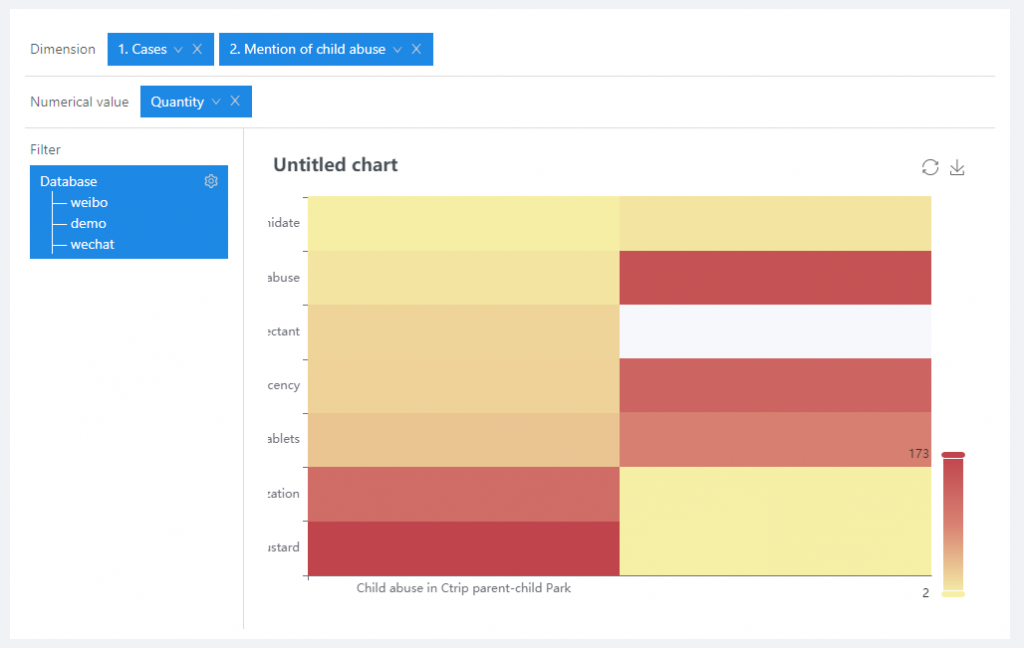
Heat Map is a statistical graph that displays the relative magnitude of the dimensional data in the form of special color highlighting. As shown in the figure below:

Heat Map is a statistical graph that displays the relative magnitude of the dimensional data in the form of special color highlighting. As shown in the figure below: