A line graph is a graphic formed by connecting various data points with straight-line segments, which displays the trend of data changes in a connected line. The line graph can display continuous data that changes over time (in a common scale setting).
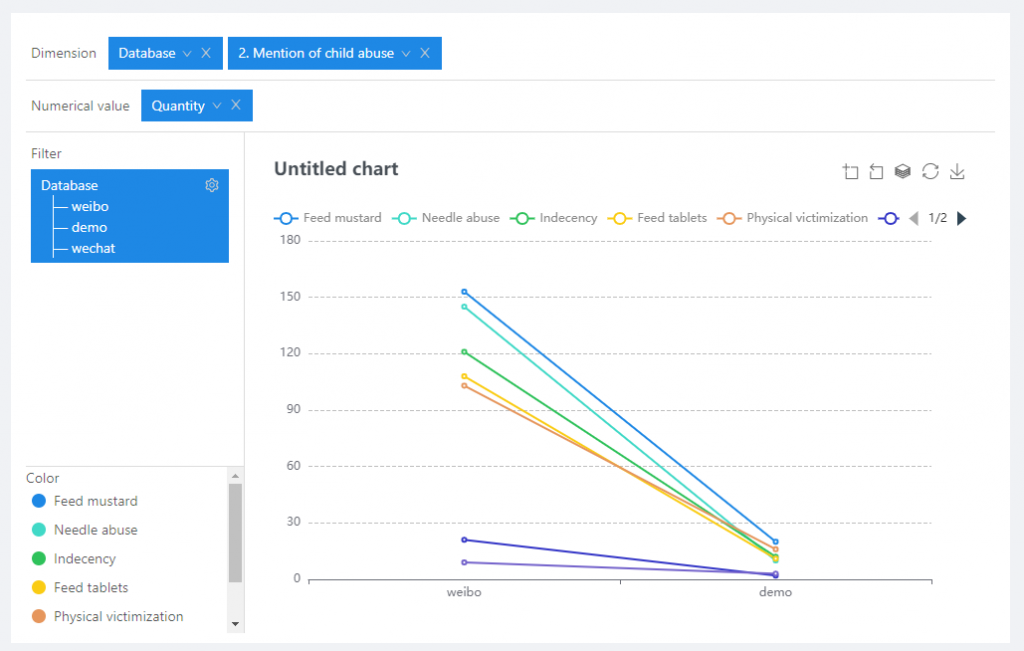
In a line graph, you can select none or only one dimension, and one or more values, as shown in the figure below: The line graph shows the different numbers of child abuse behaviors in the mentioned incidents.