
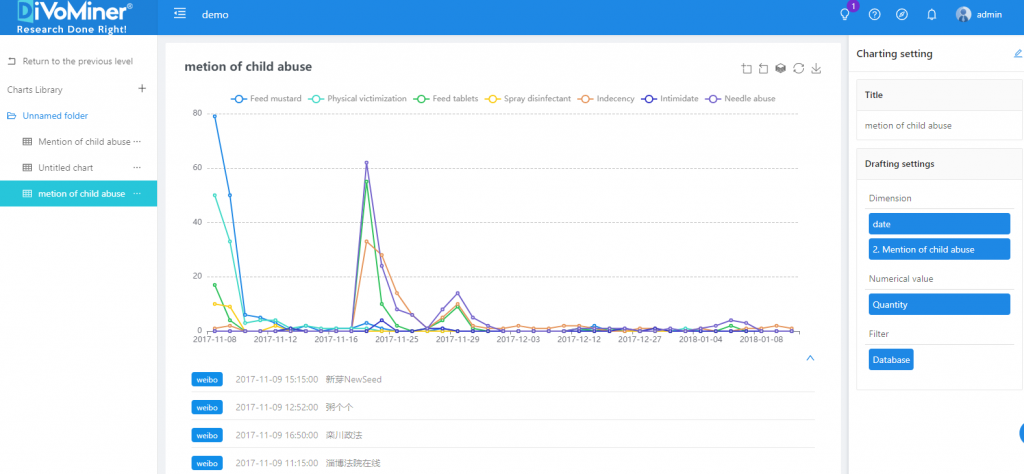
Time series is to sort a set of variables according to time, reflecting the trend of change of the variables over time. On DiVoMiner®, you only need to drag the “date” and the variable you want to analyze to the [Dimension] field, and you can immediately create the time series chart. Custom chart editing can be done through the Chart Type and Chart Style area on the right side of the page.
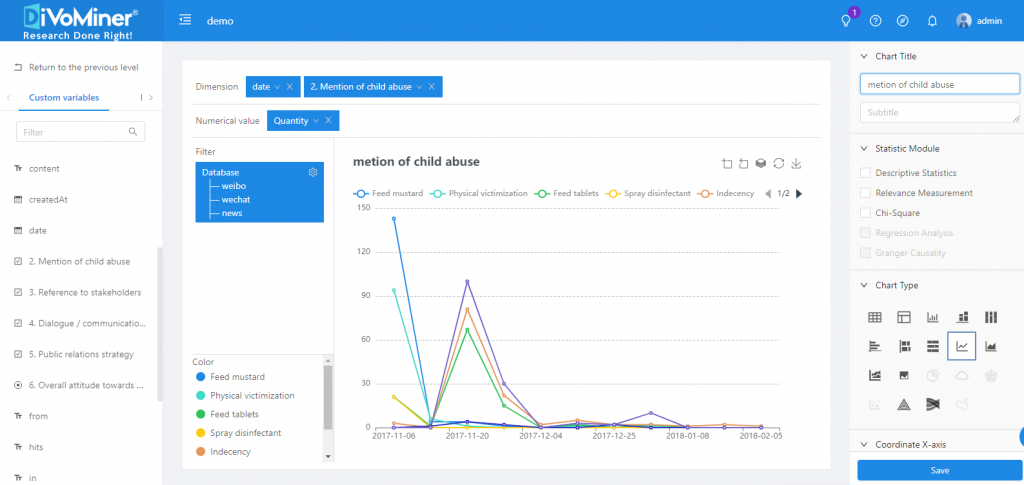
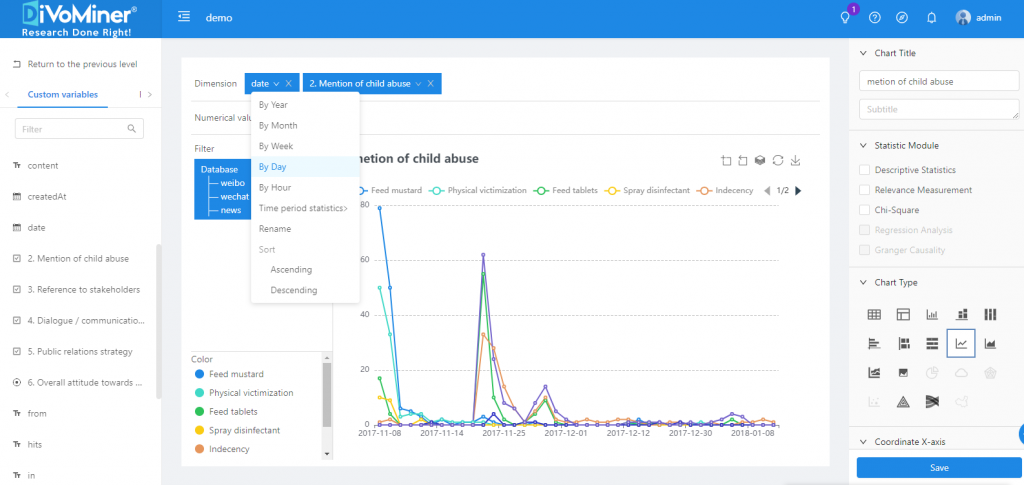
Note: The date can be selected in the unit of year, month, week, day, and hour.
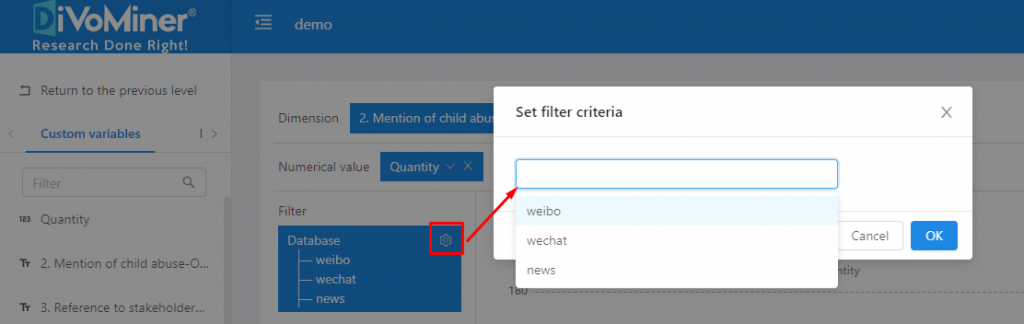
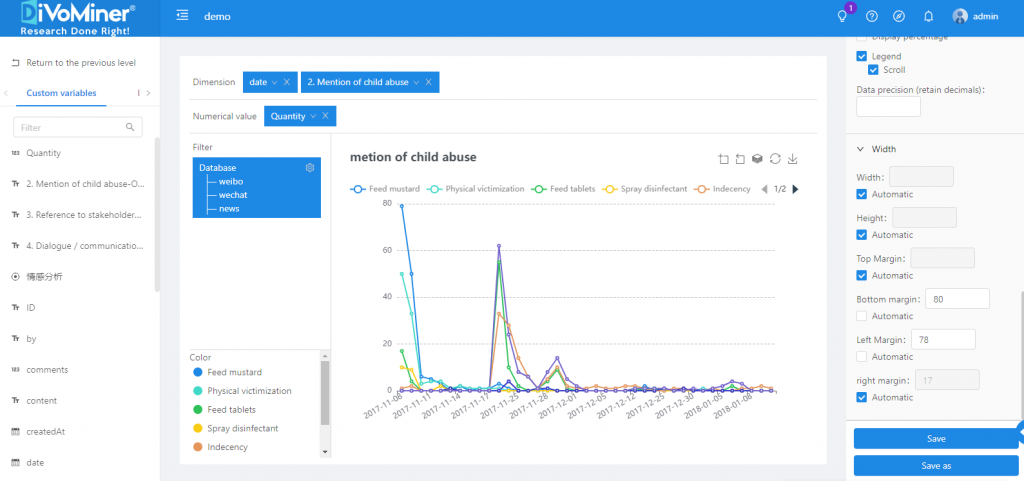
Note: The data in the sampling pool is mixed in the overall database, so if the statistical analysis chart is only for sample data, you need to specify the data with [Filter] function, to set the data scope for statistical analysis.
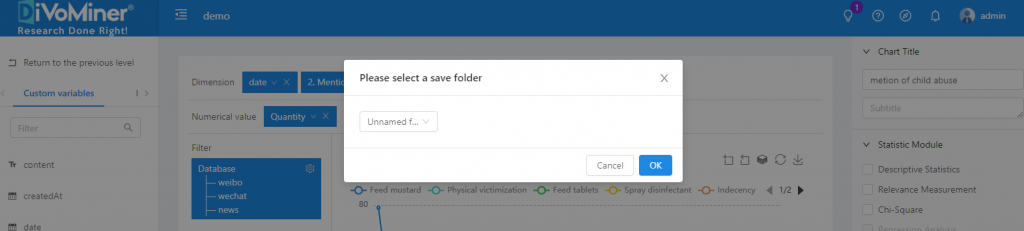
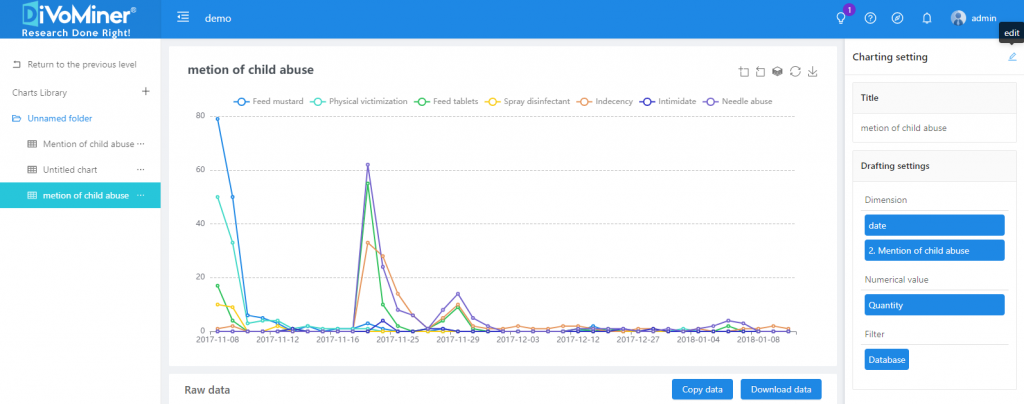
Click [Save] to save the chart to a specific folder.
Go back to the previous page (click [Back]), and you can see the statistical analysis charts created in the folder.
Note: When viewing the chart, click on the data in the chart to display the original text (e.g., news articles, social network posts, etc.) of the data, which is convenient for the results description and in-depth analysis of the data.
Click [Edit] in the upper right corner of [Chart Settings] to modify and edit the chart again.
TIPS: When creating vertical bar charts, horizontal bar charts, stacked bar charts, area graphs, and line graphs, you can set the “text direction” and “coordinate interval” in [coordinate X axis], as well as the “maximum value” and “Minimum value” in [coordinate Y axis], to adjust the display of the chart labels.
Leave A Comment?