
In the big data era, computer technology can quickly and automatically perform data mining. In order to improve research efficiency, you can firstly use the [Data Exploration] after creating the database, to have an initial understanding of the data.
After data uploading and database building, enter [Data Exploration] to have an overview of the automated data mining results.
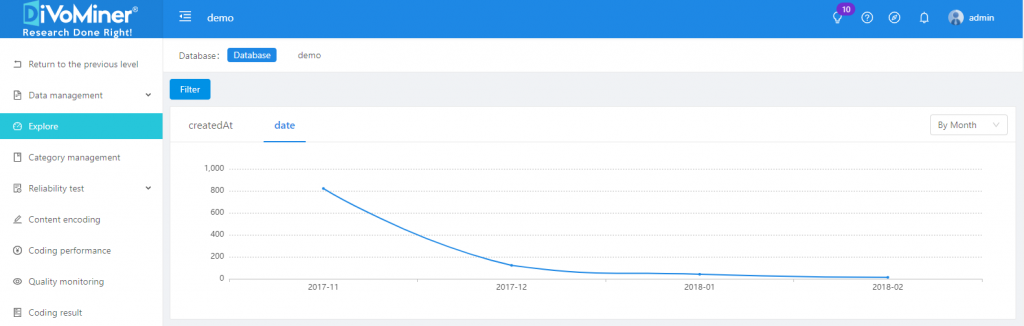
The first chart is a time series of the data volume. Tracking the changes in the data volume can quickly grasp the peaks and fluctuation trend of the data. Click on individual data point to see the corresponding details in the pop-up window.
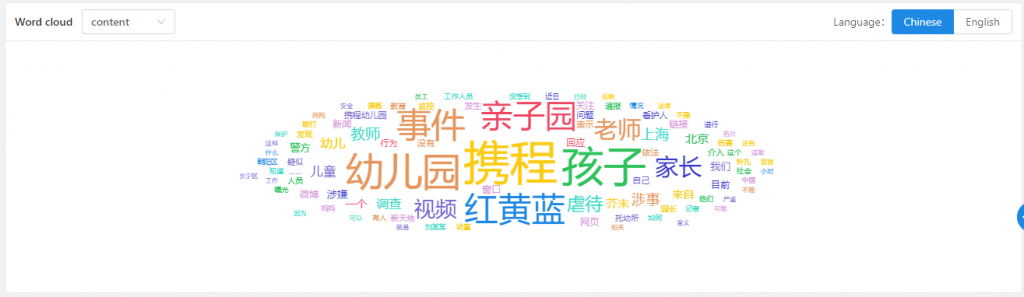
The second is a word cloud graph, which shows the major themes of the content. You can quickly learn about the mentioned people, places, organizations, key points of discussion, and other information of the data through this graph.
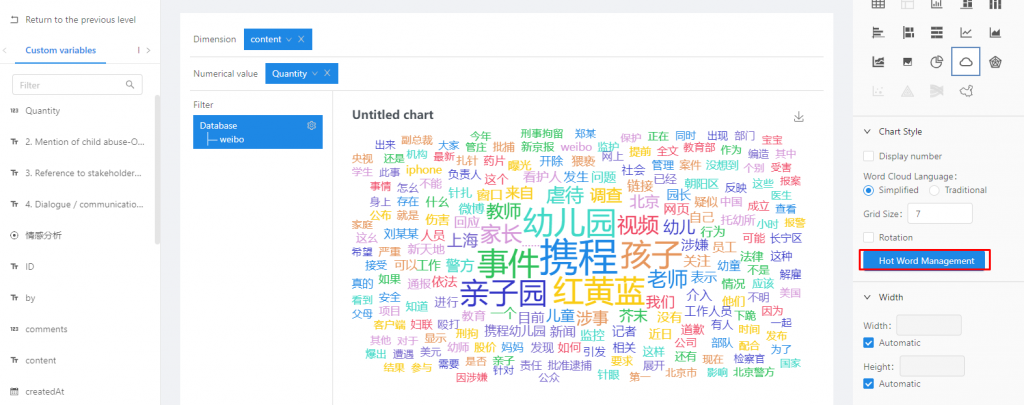
You can use the [Keywords Management] function (by creating a word-cloud graph in the Statistical Analysis section, go to [Statistical Analysis] – [Chart Type], and select [Word Cloud], and the [Keyword Manager] function is located at the lower right corner) to adjust the display style of the word cloud.
[Keyword Management] Function:
Leave A Comment?